intriguing tnlattice
Back to First Page.Phillip C. Pierce, P.E., F ASCE
Consulting Engineer
485 Nowlan Road
Binghamton, NY 13904
Introduction
So, why do those Town Lattice covered bridges still stand? This vexing question has captured the interest of some of us for a long time. This paper records the efforts of the author for the past several years on the evaluation and rehabilitation of five individual covered bridges supported by Town Lattice trusses and identifies anticipated future efforts related to this mission.
Description of the Truss
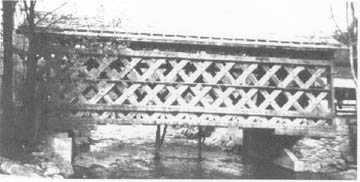
Figure 1 - Side view of a typical covered bridge supported by Town Lattice timber trusses. This is the Fuller Bridge in Montgomery, VT during its recent reconstruction.
Ithial Town first patented this style of wooden truss in 1820 as a means of minimizing the use of complicated timber joinery. The truss is typically constructed of sawn planks, about 3 inches thick and 12 inches wide. The chord sticks may be up to 36 feet long and the lattice members are often about 22 to 24 feet long. The classic configuration of Town Lattices uses pairs of chord sticks on each side of the crisscrossed web members leading to 6 vertical planes of truss members. The lattice members are usually inclined at about 45-50 degrees from the horizontal and are spaced at about 4'-0". Commonly, the bottom of the truss contains two lines of chords, one at the lowest intersections of the lattice and one staggered above at the next line of intersections. The floor system is supported by the lowest most chord. The top of the truss usually contains two levels of chords like the bottom, although there is often only a single top most chord.
The nature of this type of construction is such that the individual sticks are connected into a rigid truss by the use of wooden pegs ("trunnels" -- today's common name and proper pronunciation of "treenails"-- the more traditional term from earlier times). Each intersection of lattice are fastened with usually two trunnels in the lattice-only connections and either 3 or 4 at the chord intersections.
The classic construction, therefore, contains six vertical planes of timbers two chords, then two lattice members, and then two more chords. Therefore, at any location along the length of the chord, there are four chord sticks. When one chord stick ends, there is no specific splice of the member -- only an abrupt termination. The load that the stick supports along its length gets into/out of it via the trunnels at the intersections. Therefore, at the intersection, the remaining three chord sticks must share the load.
Figure 2 - Depicts a portion of the bottom chords (upper and lower portions) of a Town Lattice truss. The sections demonstrate the termination of one of the four chord elements at a given location along the truss.
The Problem
Ah, to the problem -- how much load goes to each of the remaining three sticks?
Due to the relative stiffness of the chords and inclined lattice members, connected by wooden trunnels, it is common to assume that all load from such chord stick termination must be carried by its sister chord stick. Hence, at a termination, the sister supports 50% of the total chord load, while the pair of chord sticks on the opposite side of the lattice support about 25% each.
However, although this is very logical as a first assumption, these complex and redundant structures seem to have substantially more strength than would be indicated by this simple load distribution assumption.
To expand the confusion, each "panel" of the truss behaves slightly differently since the tensile force in individual sticks is dependent on its relationship to the other three members with respect to distance from terminations. That is, for a 20-foot long member, with five chord/lattice intersections along its length, load must get into it from the first two intersections and out of it at the last two (the middle intersection may contribute or deduct load, depending on various parameters). Since no panel typically has more than one termination, then the pattern of the terminations of the four elements along the length of the bridge influences how much force any one-element experiences.
Alternative Approaches
Many alternatives have been investigated in an attempt to better define the strength of these structures. During the course of an extensive evaluation of 75 covered bridges in Vermont, including 40 supported by Town Lattice trusses, the writer participated in several such activities.
The first involved the development of a meticulous computer simulation using finite element software. The work was performed by Bridge Software Development International, Ltd. as a sub-consultant to the firm I worked for at the time (McFarland-Johnson, Inc). All components of the bridge were modeled in a three-dimensional structure. The trunnel connections at each intersection were modeled as single elements with properties derived for the trunnel group, acting as a five-span continuous horizontal member connecting the six vertical planes of truss elements. A rigorous analytical exercise was undertaken to determine the vectored shear in each shear plane of all trunnels under the influence of both dead and live (vehicular) forces -- no small feat in itself! The computer simulation was "checked", in part, by comparing the measured deflection of the structure under the influence of a vehicle of known weight with computer prediction. The results of this computer simulation indicated that the chord forces do indeed cross from one side of the lattice to the opposite pair of chords, across the lattice members, leading to individual chord stick values greater than 33%, but generally less than 60%.
It must be noted that during the initial phases of this computer simulation, special testing of sample Town Lattice trunnel connections was performed at the Remergence Laboratory of MIT. While such tests were limited in nature, they nonetheless, offered additional insight into the behavior of these types of trunnel connections. The results of the tests provided support for the assumed capacities of the connections found in typical Town Lattice trusses.
During an especially vigorous evaluation of another bridge this past summer (by my own firm under contract to a Town in Vermont), I have become convinced that the current finite element computer simulation has not satisfactorily accounted for potential inelastic behavior of the trunnel connections. This conundrum is manifested in the disparity of having field measurements nearly replicate predicted structure deflections under known loading, while leading to seemingly conservative load distributions among the chord sticks.
The Latest Chapter
Now, on to the latest in this evolutionary evaluation of Town Lattice trusses.
Faced with the need for major rehabilitation of another Town Lattice truss owned by my employer (the Delaware County Department of Public Works), we have opted for additional field-testing aimed at furthering the knowledge of load distribution in the chords. With the assistance of Bridge Diagnostics, Inc., of Boulder, Colorado, 46 transducers were attached to the top and bottom of the lower bottom chord sticks at seven separate locations along the trusses of the bridge. Refer to Figure 3. These transducers are basically strain gages that can be easily mounted to an element to measure the change in length of the element when subjected to a loading. The top and bottom pairing allowed averaging of the results to determine axial load, thereby avoiding the complications of the additional stresses from flexure due to direct support of the floor beams. The seven locations near the center of the single-span truss enabled comparisons of load sharing at different locations along the truss.
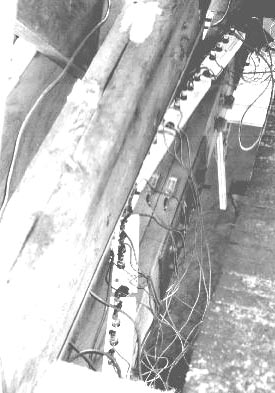
Figure 3 - Depicts the 'rat's nest" of wiring accompanying the installation of the 46 transducers. The equipment is shown mounted on top of the lower bottom chord element. The upper bottom chord element is in the foreground. The edge of the nail- laminated deck is shown along the right edge (a curb timber had been removed).
The mounting of these transducers to the chord elements required a work platform to gain access to the area and removal of the siding adjacent to the desired installation sites -- see Figure 4. Since we were getting ready to rehabilitate the bridge anyway, we were able to easily provide the platform and remove the siding. The actual installation of transducers was accomplished by wood screws and washers and was completed in a few hours. The recording of the data from passage of a known weight vehicle was accomplished in an hour including three passages to obtain comparison values. Hence, the technical representative of BDI was on site less than a day. Their office evaluation and manipulation of the data required a few days and a concise report was provided that included minimum and maximum strain information in graphical and tabular form for the various locations with a discussion of relevant observations.

Figure 4 - The temporary platform suspended beneath the bottom chords to enable access for strain gage installation. The siding was removed to facilitate the testing, but the bridge was scheduled to undergo a complete rehabilitation after the testing, which required siding removal for other purposes.
Since I find it more helpful to understand data by "playing" with it myself, BDI was able to provide the information in an Excel Spreadsheet format. Given the data, I was able to manipulate it to examine a number of different aspects, including axial indications as well as bending indications. I found this activity to require relatively little time compared with the labor intensive examination of the Finite Element analysis results, yet it obviously is limited to discrete locations on the bridge.
Surprisingly, the results, when converted to force indicate substantially smaller values than were anticipated by a Plate Girder Analogy analysis. This is a simplified means of examining forces in a truss by simulating its behavior as a plate girder with equivalent stiffness. At this time, we continue to evaluate the data for potential explanations and ramifications.
We can report that we are extremely pleased with the information received by use of this technology, and the service provided by Bridge Diagnostics, Inc., in particular. We are now considering various potential follow-up tests at our other two historic covered bridges.
While this work has not concluded the search for full understanding of the behavior of the Town Lattice timber truss, we are another step closer. Additional laboratory testing is being planned, as well as expanded field testing and related computer simulations (looking for sponsors!).
Mr. Pierce owns and operates a specialty consulting engineering practice under the name of Phillip C. Pierce, P.E. Phil is also employed by the Delaware County (NY) Department of Public Works where he serves as Deputy Commissioner in charge of Engineering.
 Joe Nelson, P.O Box 267, Jericho, VT 05465-0267
This file posted March 13, 2001, revised April 26, 2007
Joe Nelson, P.O Box 267, Jericho, VT 05465-0267
This file posted March 13, 2001, revised April 26, 2007